
by Chris Eastman on Aug 31, 2023 9:45:00 AM
Introduction: Does DNS query activity change during an outage?
As a member of the DNSFilter Labs team, one of our responsibilities is to continually evaluate and investigate new sorts of data that become available from multiple sources. In mid-June, one of our Software-as-a-Service (SaaS) providers suffered an outage. As a result, the flow of critical data was interrupted for several hours, which then cascaded into an abrupt halt of active research. The outage was only temporary, but coming out of this was a short discussion with my colleagues about whether DNS query log data could be used to reliably identify a service outage, or even predict it. Based upon this conversation, I decided to dig further into the DNS query log data that was available to see what sort of behavior would be seen before, during and after a SaaS service outage.
Investigation into how DNS query activity adjusts during service degradation
In order to start the investigation, I first had to identify a few SaaS services that have experienced recent outages, or service degradations, which could point me to some real world examples to further research. I chose the following example services as they are popular SaaS services that are fairly heavily used, which should entail significant DNS queries during normal business. Having a constant rate of DNS query activity prior to any service impacting incident would be key in identifying abnormal behavior.
Regarding the following charts and analysis, the source data was compiled from several billion DNS queries, ranging over various time frames. This data provided a large enough data set to identify specific trends and spikes that correspond to reported periods of service degradation for their associated systems. All data has been aggregated per hour in order to give a better visual sense of overall trends.
Note in the following graphs below the scale on the y-axis represents the number of DNS queries found in my test sample, and this was left in primarily to show a relative comparison between related queries, for example showing that there are exponentially more queries to a system like AWS as compared to queries to the AWS health status page. If data for multiple queries was put on a single chart, the lower traffic domains would barely register as compared to the higher volume queries.
Partial service degradation: GitHub; cloud-based software repository and version control
The first example service I decided to further research is Github, the software repository and versioning control platform. The system is accessed constantly by software developers; a degradation to Github services could severely impact productivity, or even break existing software development pipelines. Depending upon the timing of such an incident, planned maintenance or system upgrades could be delayed, or even canceled.
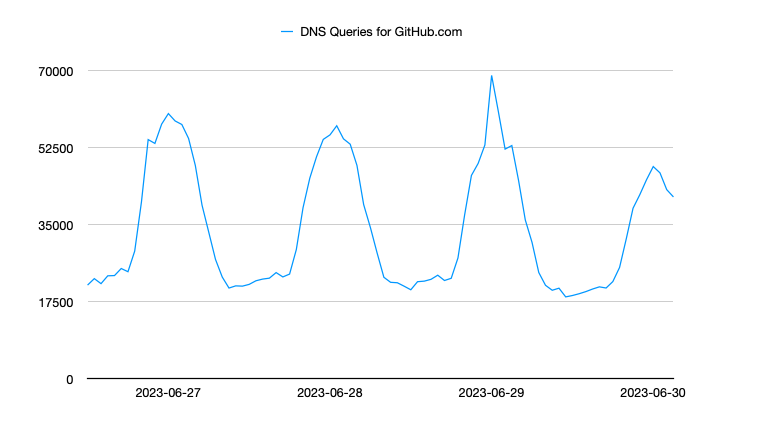
For my deeper look into Github services, I decided to review DNS activity for the githubstatus.com status page as well as access to the github.com system itself during June 29, 2023, the date of a recent service degradation. This incident resulted in the GitHub service being inaccessible in parts of North America and South America.
The below chart shows multiple days of DNS query activity for github.com. You can easily see the daily cycle of activity, corresponding to US based primary working hours; however on June 29th, there was a sharp spike of increased activity that lasted about two hours, after which the typical daily cycle appears to continue. This data is not overly telling, but does show a pattern of increased activity during a service degradation period that resumed normal activity at the conclusion of the incident. This spike of activity likely represents users that were trying, and retrying, to access services impacted by the incident.
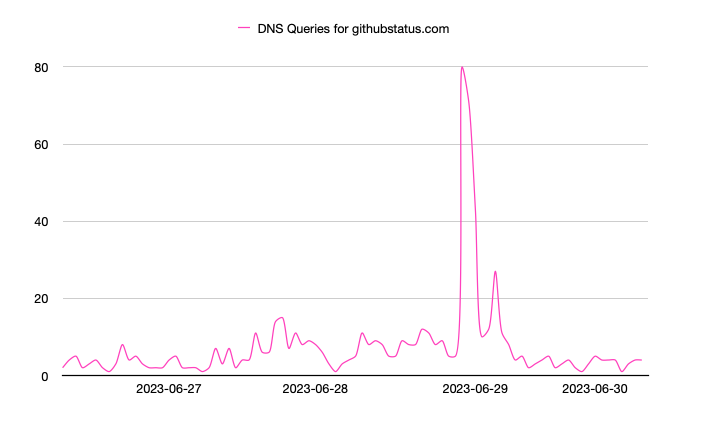
By comparison, the following graph shows request data for the githubstatus.com system, which gives information about GitHub services and ongoing issues. Typical usage for this site is very low, which makes sense as there is typically little reason to check the status of a service unless there are issues. Again on June 29th, a sharp spike occurred showing traffic to this status page increased nearly 8 times normal traffic during the reported incident, however it did calm back down after the incident had resolved.
It is interesting that this spike to the status page actually lasted longer than the spike to the base github.com domain; however, it seems reasonable that immediately following an incident users are going to be more diligent in watching for any issues that may occur directly following an incident, resulting in additional traffic to the status page.
For both of these GitHub-related domains, the DNS query traffic does indicate that during a period of recent service degradation, the traffic increased significantly as compared to normal activity.
Multi-service outage: Atlassian; Productivity tools suite
For my second example, I thought it may be interesting to look a little deeper at the multi-faceted SaaS system Atlassian, which offers a variety of productivity services. With this investigation I choose status.atlassian.com, confluence.status.atlassian.com and jira-software.status.atlassian.com as the specific domains used for analysis.
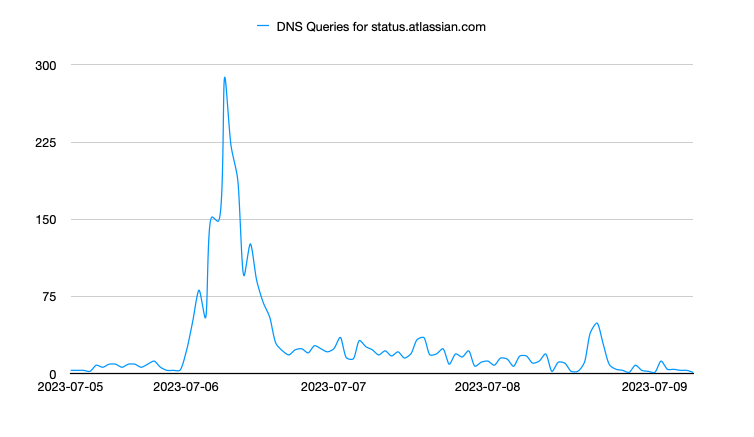
On July 6, 2023, Atlassian experienced a fairly substantial service outage that impacted a number of their services. As Atlassian offers a number of very different services, their primary status page is more of a landing page where the user can then select their desired service in order to get more detailed information.
Like most status pages, the normal traffic to this site is very light, however it can be seen distinctly on July 6 that activity increases exponentially during the course of the incident. More interestingly, after the incident the traffic to the status page remained higher than usual for the following few days. This was not a huge increase in traffic, but still noticeable.
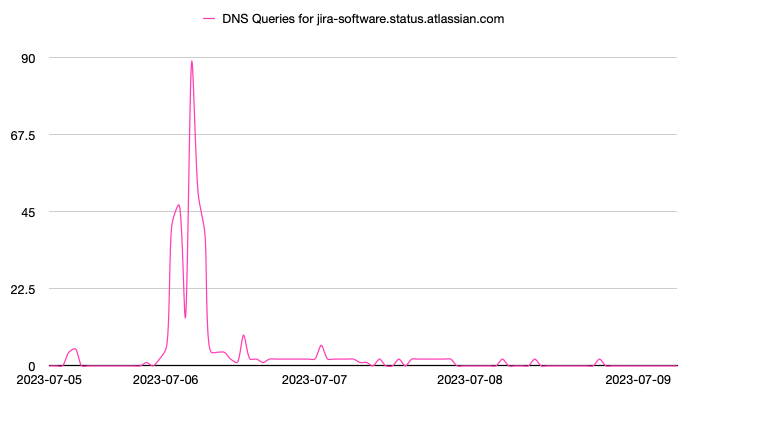
To dig further into the Atlassian status pages, the Jira Software status page was evaluated. The Jira Software is used to track and plan project-related tasks. During the service outage on July 6th, a clear spike of activity to this status page can be seen. It resumed normal levels of activity post-incident.
The final Atlassian page I looked into was the status page for Confluence. Confluence is a hosted workspace for teams to share documentation and other collaborative artifacts. This system followed a similar pattern when compared to the other Atlassian domains during the outage period.
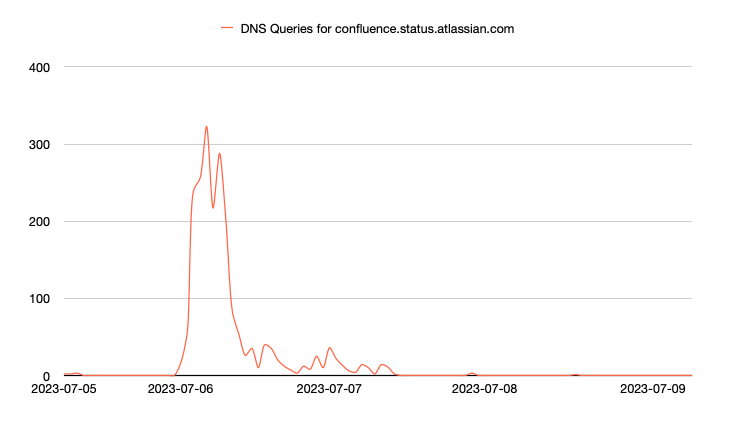
This look into the impact of a service outage on the different Atlassian services is interesting and does show a common theme of increased DNS query traffic during, and sometime shortly after, a service degradation. When viewing this sort of analysis across Atlassian’s suite of services, it could very much reveal services that were impacted by the issue as well as services that were only minimally affected.
Hosted infrastructure outage: AWS; Cloud-hosting provider
For my final example, I chose the system that prompted my investigation into this topic: Amazon Web Services. AWS is one of the major public cloud providers, hosting numerous systems and components, for business and personal use. In addition to many businesses' own infrastructure, AWS is used to back a multitude of SaaS services and hosting providers that can, unfortunately, also be impacted by a service degradation of AWS services.
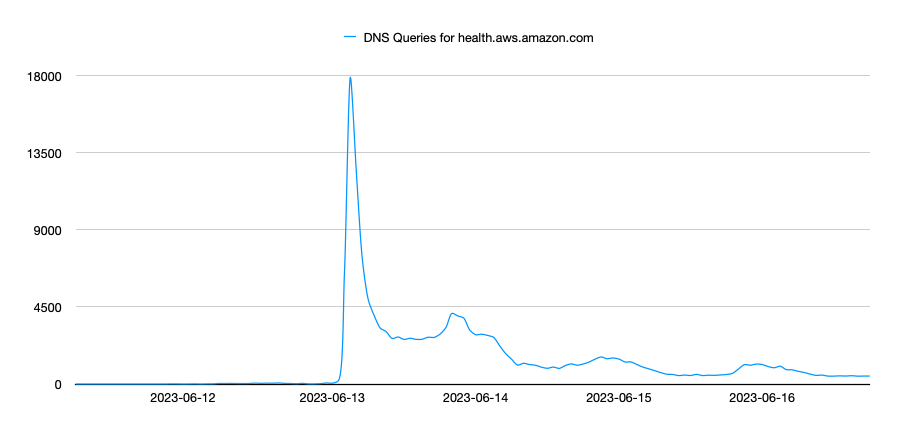
To get an overall view of the impact of an outage within the AWS ecosystem, I have used the AWS health check domain health.aws.amazon.com as well as console URLs for both the US-East1 region and the US-West1 region. On June 13, 2023 the AWS US-East1 region experienced an incident that resulted in loss of access to a number of AWS services as well as the access to the AWS GUI (Graphical User Interface). Luckily, most hosted resources seemed unaffected. However, Lambda functions were fully offline as was access to the AWS GUI which prevented UI access to view the status of resources or make updates.
To start, I reviewed the health.aws.amazon.com health page. The following graph shows the extremely large spike of DNS query traffic on June 13 corresponding directly to the service outage. Before the outage, the query traffic for this domain was nearly negligible. For several days after the incident, however, this traffic remained much higher than usual. This pattern, similar to other examples, leads me to believe that the one result of these service outages is that users are more diligent about checking on service status pages and actively monitoring for additional service interruptions.
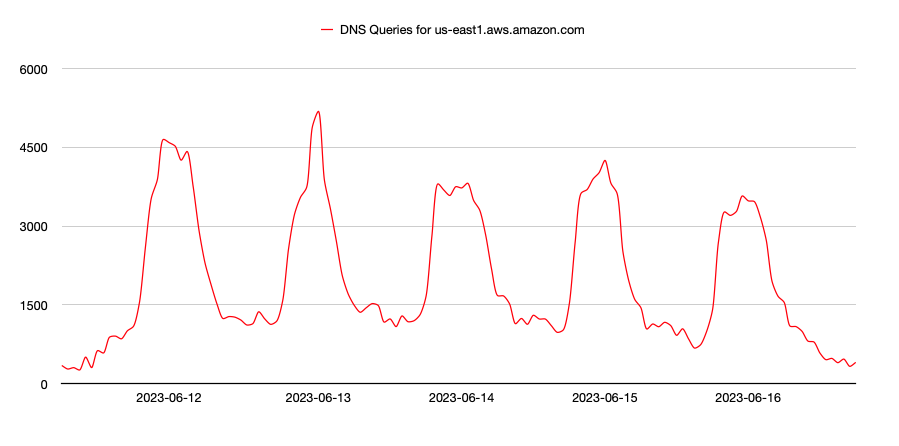
The next example shows the console URL for the US-East1 region. This region experienced the service outage on June 13 and the traffic pattern below indicates this with a small spike. As compared to other examples, this change does not appear overly dramatic, and after consideration it may in part be due to the fact that typical AWS console users will not notice an outage unless they are already accessing the system. In this case, an outage would not likely result in excessive new activity to the console—like a status page may experience—though it would still have observable, increased traffic due to the user base repeatedly trying to access the downed system.
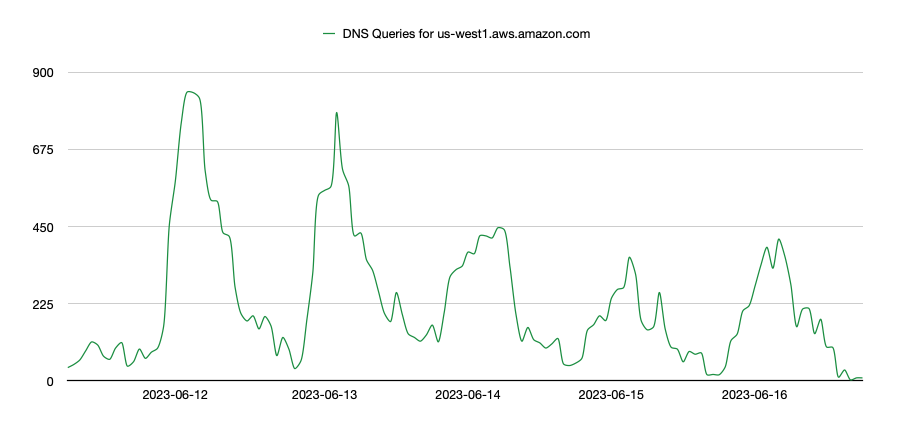
This final example related to AWS is the console URL for the US-West1 region. This region did not appear to be impacted by the incident on June 13th, however the query volume pattern still seems to indicate a similar spike as the US-East1 region experienced, although with a lower amount of traffic. As the ability to log into the AWS GUI was impacted during this outage, this could have limited access to the US-West1 region, even though its infrastructure remained stable, partially accounting for the spike in queries.
As expected, the impact to DNS query traffic during an AWS outage is interesting and reveals certain patterns both to the domains associated with services but more noticeable with the service status pages. As there are a multitude of various domains and URLs associated with the different AWS services, a more in-depth analysis of these details could reveal additional patterns as related to activity during service degradation.
We have data; What should we do with it?
These examples are to give a high-level review of the type of data and patterns that can be evaluated based upon DNS query requests, specifically during interesting time frames when service degradations were experienced.
Now, going back to my original idea about whether this sort of analysis of DNS query data could in fact be used to identify, or predict, degradations in online services. There are obvious patterns that arise with this activity during a period of service degradation, and this data could be used to identify a sudden spike of activity that is indicative of an issue; however, there could be some difficult technical challenges to overcome in order to have this data be useful in near real-time.
The technical capability to reliably compile a comprehensive set of DNS query data that could be used for this sort of exercise in near real-time would be challenging, but not impossible. If this challenge was overcome, this sort of data absolutely could be used to identify early warning signs that a service degradation has occurred, or minimally this could raise alerts prompting additional investigation.
A major outage often takes time to propagate, so sometimes having a 15 or 30 minute warning of an impending service degradation may be sufficient to move resources, adjust operations or preserve research depending upon the impacted systems. With all evaluations like this there would be efforts needed to refine the criteria based upon the specific use case, as well as the need to monitor and refine your patterns over time as expected activity may continue to change over time.
Stepping away from using this as a predictive measure, it is also feasible to use this data in other manners, especially when looking for historical trends and patterns. Once a set of high quality, diverse DNS query data can reliably be assembled for a specific time frame, there are a vast number of potential realistic uses for this data.
The following thoughts were compiled based upon some light research as well as discussions with my colleagues related to how DNS query data can be used to enhance or support daily operations.
Monitoring online service quality and potential alerting
Above we have already noted the challenges in having the necessary data available in real-time; however, those challenges can be overcome, or reduced, in order to provide the necessary data to be accessible with minimal real-time lag. In this case the data could be used to provide high-quality monitoring of certain domains (status pages for example) with a goal of identifying unusual patterns or activity spikes that may indicate a service degradation period. Based on this data, additional alerting could be used to help identify service outages early, and perhaps even react by adjusting resources to more stable nodes or infrastructure. Having data that is not required to be real-time also opens the door to having pre-processed data that could allow for more complex monitoring approaches, with the assumption that the pre-processing may take additional cycles however this will not be as critical if not responding in real-time.
Review of online service past performance
In many businesses, there is often the need to make use of new SaaS services to address business needs, whether that is related to software systems or supporting systems like financial services. There are already numerous service providers and new ones that are released each day. With this ever-changing landscape, it can be a difficult decision to dedicate business resources by investing into a new online SaaS service. However, by using this sort of DNS query analysis one might be able to generate a likely summary of a service’s availability over time. For example, if there is a need to evaluate a new cloud hosting provider one could use the DNS query activity to their health status page as a potential indicator of past incidents. If there was a consistent pattern of frequent spikes in status page DNS activity, this could be a reliable sign that the system’s users have experienced frequent service degradation resulting in activity to the service provider’s status page. If this was taken into account while evaluating a SaaS service, it could help identify unreliable online systems or at least add data for consideration.
Research purposes and machine learning
Like all data, this DNS query data could be used for research purposes. For the above examples, data was aggregated for each hour, however if this data was kept raw, or aggregated to a very short time period like minute or second, it would be even more valuable for analysis. Further uses for this data could entail it being used to generate machine learning models that are designed to identify additional patterns and trends or contributing to larger scale ML systems that analyze DNS query log activity and patterns.
Forensic analysis and review
After any sort of cyber attack, there is usually a phase of detailed forensic analysis to determine what exactly took place, determine a timeline, and establish a full analysis of the scope of an attack. By utilizing DNS query data for impacted systems, and their status pages, one may be able to deduce which systems were impacted—in what order—and derive additional details based on this data. This could be very useful for wide-ranging attacks against multiple services, or even against larger hosting environments like AWS, and although its usefulness may not be immediately visible, it could help contribute to the larger picture as this sort of post-incident analysis is performed.
As uses for this sort of data vary case by case, there are situations where an in-depth analysis of DNS activity against domains, and associated status pages, would reveal valuable information that could be utilized in a variety of manners. In some cases, it may only add minimal value and there may be better-suited tools. For example, system monitoring and uptime tools will provide better real-time feedback.
For other cases, including research and forensics, this sort of data can be seen as one of multiple data sources used for analysis, and I believe it could provide valuable insight for a number of projects. I think the most intriguing aspect of this sort of data is that it, along with other DNS query data, can be used in conjunction with machine learning models to help identify activity patterns that would then be used to potentially identify novel threats or suspicious activity. This sort of use case is a common scenario at DNSFilter and the Labs team is constantly finding new uses for this sort of data with the end goal of providing better threat protection, and domain classification, for end users.
In summary
With this brief set of examples and some cursory analysis, we can see that we are able to clearly identify specific patterns of DNS query activity against system domains as well as related status page sites, during periods of service degradation. The pattern is most distinct with the status pages, however we have also observed similar patterns with access to impacted services. On the surface the potential of this sort of trend analysis may seem rather simple, but this approach is easily expanded to cover multiple systems that may be able to reveal unexpected—yet useful—relationships giving one more view into the vast cyberspace ecosystem.
Start a free trial of DNSFilter today to dive into your own unique network data.

 The AI Tools Your DNS Can't See
CyberSight's new AI Usage Report sees what DNS misses: Locally installed AI clients, locally-hosted models, and the active time employees spend in each.
 DNSFilter and Pax8: A Platinum Partnership Heads to Beyond
The relationship between DNSFilter and Pax8 just got stronger. We're proud to announce that DNSFilter has reached Platinum partner status with Pax8 and we're heading to Pax8 Beyond as a Gold Sponsor June 7-9.